Kubernetes Logging with OpenObserve on K3s
In a multi-node K3s cluster, I deployed OpenObserve using S3 for log storage and PostgreSQL for metadata, with logs collected via OpenTelemetry. Within half a day, I had logs and Kubernetes events flowing into dashboards, with significantly fewer moving parts compared to traditional ELK setups.

Last month, my senior asked me to explore Kubernetes logging using the ELK or EFK stack. I did try, but I struggled quite a bit. Not because ELK is bad, but because the ecosystem is wide and deep, and my own skill level wasn’t there yet. I spent more time figuring out components and configs than actually looking at logs.
When the task was followed up again this week, I revisited the problem. While researching alternatives, I came back to OpenObserve. I had actually bookmarked it a long time ago when searching for “New Relic alternative”, but never really had time to explore it properly. This time, I did.
This post documents that exploration. It’s not a benchmark and not a production claim. Just what I ran, why I chose it, and what I observed.
Environment and Goal
The setup ran on a multi-node k3s cluster. The whole exploration took about half a day. Logs and Kubernetes events were collected using default OpenTelemetry behavior.
OpenObserve was exposed using NodePort for simplicity. For staging or production, Ingress would make more sense, but here the goal was to reduce moving parts and get visibility quickly.
Architecture Overview
The data flow is simple.
Kubernetes sends logs and events to the OpenTelemetry Collector.
The collector forwards them to OpenObserve.
OpenObserve stores logs in Amazon S3 and metadata in PostgreSQL.
Inside the cluster, OpenObserve runs Ingester, Querier, Alertmanager, and NATS. Externally, it depends only on S3 for log storage and RDS PostgreSQL for metadata. The bundled PostgreSQL from the Helm chart was disabled.
Storage Decisions
Logs are stored in S3. Early on, I noticed many objects were smaller than 128 KB. This matters when thinking about Glacier, because Glacier has a 128 KB minimum billable object size. Moving small log objects there can increase cost instead of reducing it.
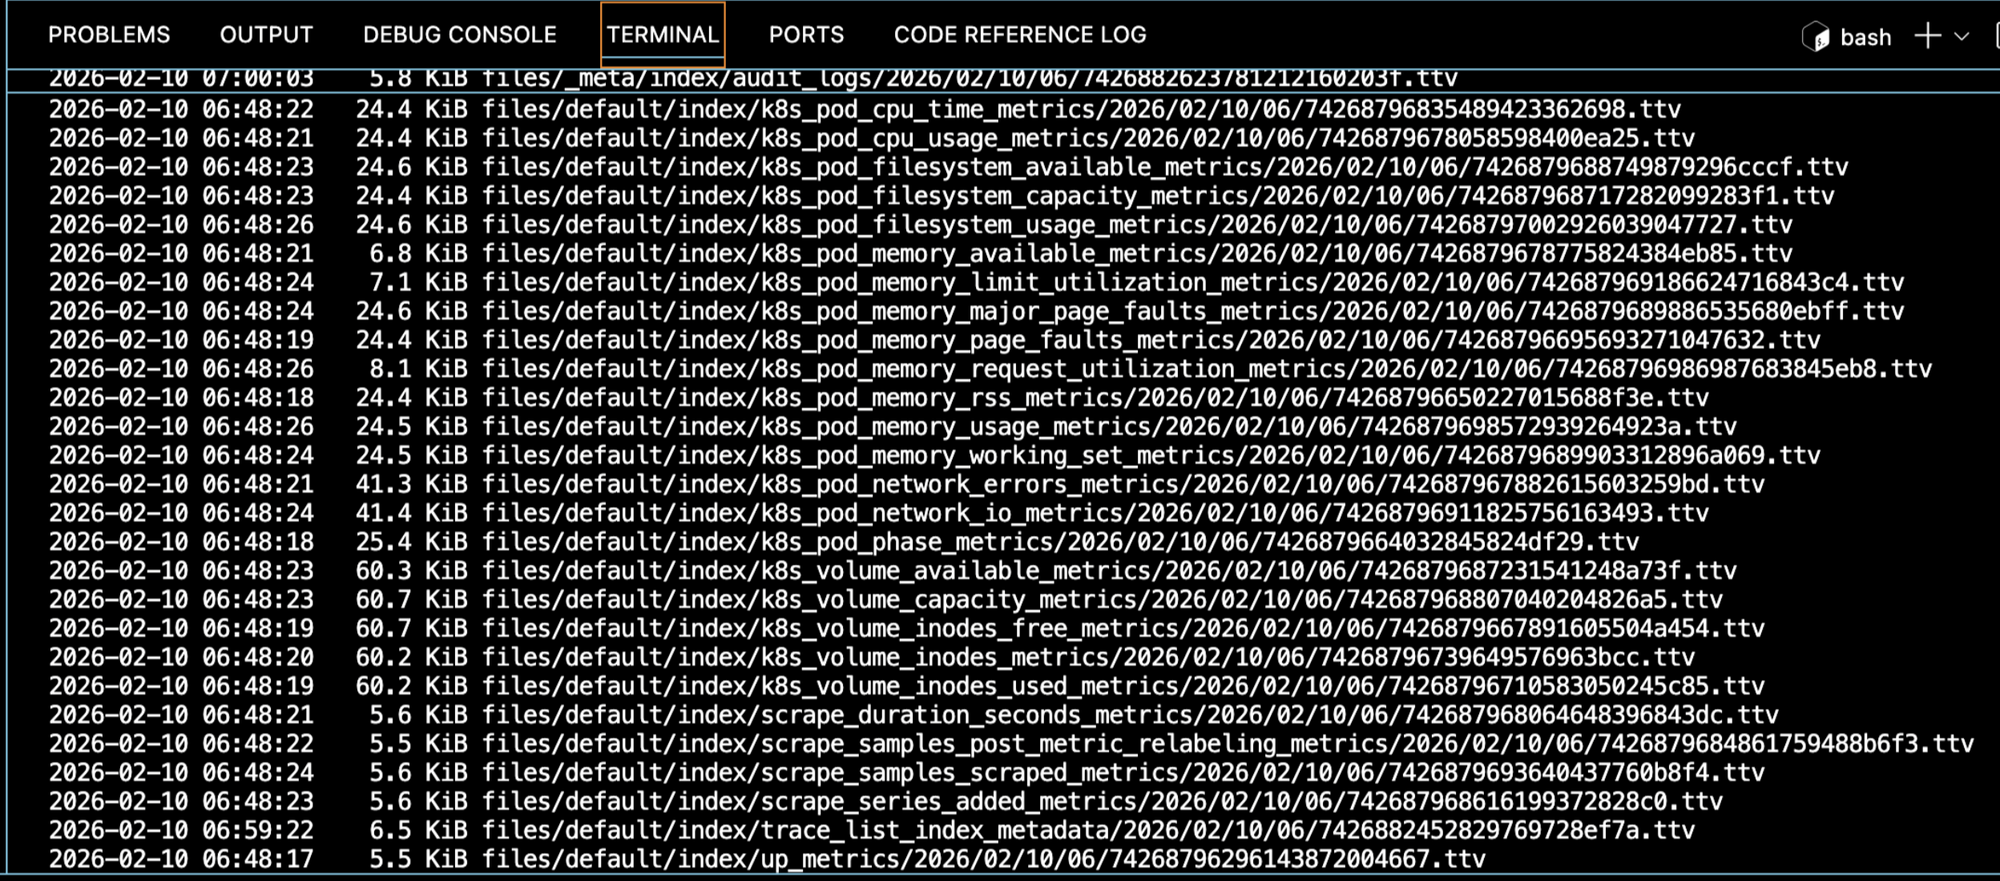
Because of that, Glacier lifecycle rules were intentionally deferred. This needs longer observation time.
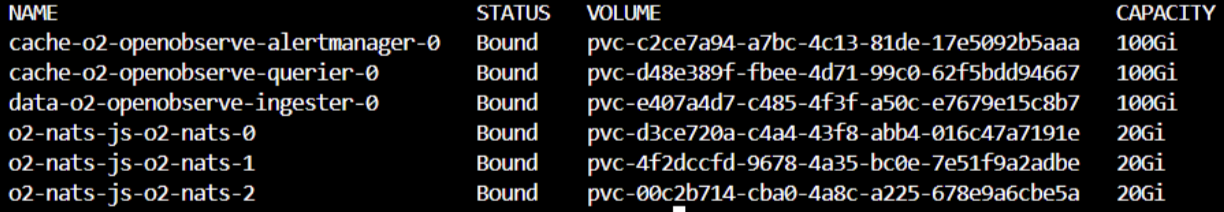
Even with S3, OpenObserve still needs PVCs for caching and buffering. Default sizes from the Helm chart were kept. Shrinking them too early usually creates more confusion than insight.
Deploying OpenObserve
First, I pulled the default Helm values and edited them locally.
curl https://raw.githubusercontent.com/openobserve/openobserve-helm-chart/main/charts/openobserve/values.yaml -o values.yaml
S3 credentials were configured in values.yaml.
ZO_S3_ACCESS_KEY: "AKIAIOSFODNN7EXAMPLE"
ZO_S3_SECRET_KEY: "wJalrXUtnFEMI/K7MDENG/bPxRfiCYEXAMPLEKEY"
ZO_S3_BUCKET_NAME: "openobserve-logs"
ZO_S3_REGION_NAME: "ap-southeast-1"
Metadata storage was switched to PostgreSQL, and the bundled PostgreSQL was disabled.
config:
  ZO_META_STORE: postgres

auth:
  ZO_META_POSTGRES_DSN: "postgres://postgres:password@rds-endpoint:5432/openobserve"

postgres:
  enabled: false
Then OpenObserve was installed using Helm.
helm repo add openobserve https://charts.openobserve.ai
helm repo update

kubectl create namespace openobserve

helm install o2 openobserve/openobserve \
  -n openobserve \
  -f values.yaml
For access, I exposed the router service using NodePort.
kubectl -n openobserve edit svc o2-openobserve-router
Change spec.type to NodePort.
Connecting Kubernetes Logs
Logs and events were collected using OpenTelemetry. This part has some dependencies that are easy to miss.
First, cert-manager:
kubectl apply -f https://github.com/cert-manager/cert-manager/releases/download/v1.19.0/cert-manager.yaml
Then Prometheus Operator CRDs, required by the OpenTelemetry operator even if Prometheus itself is not installed.
kubectl create -f https://raw.githubusercontent.com/prometheus-operator/prometheus-operator/main/example/prometheus-operator-crd/monitoring.coreos.com_servicemonitors.yaml
kubectl create -f https://raw.githubusercontent.com/prometheus-operator/prometheus-operator/main/example/prometheus-operator-crd/monitoring.coreos.com_podmonitors.yaml
kubectl create -f https://raw.githubusercontent.com/prometheus-operator/prometheus-operator/refs/heads/main/example/prometheus-operator-crd/monitoring.coreos.com_scrapeconfigs.yaml
kubectl create -f https://raw.githubusercontent.com/prometheus-operator/prometheus-operator/refs/heads/main/example/prometheus-operator-crd/monitoring.coreos.com_probes.yaml
After that, the OpenTelemetry operator was installed.
kubectl apply -f https://raw.githubusercontent.com/openobserve/openobserve-helm-chart/refs/heads/main/opentelemetry-operator.yaml
Then the OpenObserve collector was deployed in a separate namespace.
kubectl create namespace openobserve-collector
helm upgrade --install o2c openobserve/openobserve-collector \
  -n openobserve-collector \
  --set k8sCluster=cluster1 \
  --set exporters.'otlphttp/openobserve'.endpoint=http://o2-openobserve-router.openobserve.svc.cluster.local:5080/api/default \
  --set exporters.'otlphttp/openobserve'.headers.Authorization='Basic cm9vdEBleGFtcGxlLmNvbTpCSXVETFZwdnNXbWZyMW9U' \
  --set exporters.'otlphttp/openobserve_k8s_events'.endpoint=http://o2-openobserve-router.openobserve.svc.cluster.local:5080/api/default \
  --set exporters.'otlphttp/openobserve_k8s_events'.headers.Authorization='Basic cm9vdEBleGFtcGxlLmNvbTpCSXVETFZwdnNXbWZyMW9U'
One important gotcha: if the Authorization header is wrong, logs are silently dropped. No errors, just empty dashboards.
Closing Thoughts
Compared to my earlier ELK and EFK exploration, OpenObserve was easier for me to reason about. Fewer components to wire together, fewer decisions before seeing value.
ELK is powerful, but for me, the ecosystem complexity combined with my own skill gap slowed things down. With OpenObserve, I had logs flowing and dashboards visible within hours.
There are still open questions, especially around long-term S3 object sizing and lifecycle policies. But OpenObserve is no longer just a bookmarked link. It’s now a concrete option that I’ve actually run and understood.